


dB(A), dB(C), dB(G), dB
Decibel
Emission
Frequency
Sound pressure
Sound power
Guaranteed sound power
Immission
Immission relevant power
Lden
Ldn
Lnight
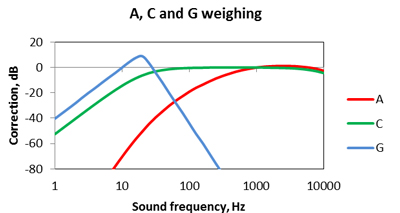
The letters A, C and G refer to the correction (weighing) which is applied to sound values of different frequencies.
In most cases the A weighing is applied. The sound volume is then rendered in dB(A). This weighing corresponds most closely to our ear’s sensitivity for sound: the low and high frequencies are not heard equally well. The sound value in dB(A) is representative for hearing damage in the long term.
The curve of the C filter is flatter. In this weighing the low sound frequencies receive relatively more weight, in comparison to the curve of the A filter (you see in the diagram that the green curve lies higher than the red curve with the lower frequencies). Therefore, the sound level in dB(C) is more suitable (better than the dB(A) value) for the assessment of the specific nuisance due to bass sounds at musical events.
With the G weighing one particularly takes into account the infrasound frequencies between 10 and 20 Hz, whereas lower and higher sound frequencies are left out. Sound values in dB(G) are sometimes used with the specific assessment of nuisance from infrasound, e.g. from wind turbines.
Sometimes no correction is applied, and only the pure sound pressure is measured (for ultrasound, infrasound). In case of measuring without weighing, one refers to just dB or dBZ (dB without filter).
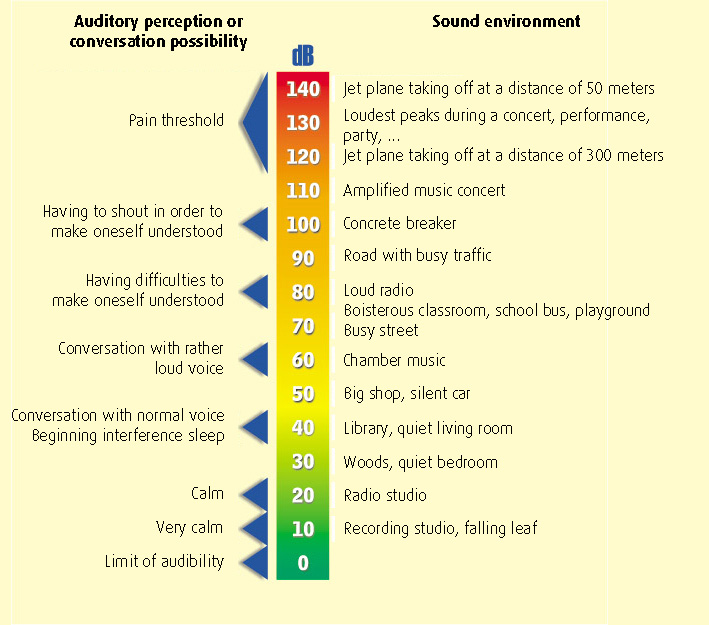
The decibel (dB) is not a real unit, but a relation between two values on a logarithmic scale. In acoustics, the decibel is amongst other things used to describe sound pressure: then it is the relation between the air pressure in a sound wave and the fixed reference pressure L = 20 log (P/P0). The fixed reference pressure P0 corresponds to the hearing threshold (20 µPa/micropascal). Through the conversion into dB, suitable figures are easily obtained. The minimal sound pressure is rendered as 0 dB. Large relations are described with a relatively small number.
Below you will find a sound scale in decibel with in addition examples of sound environments which correspond to these.
With the sound emission, the sound of a machine or appliance is meant. The sound emission is usually referred to as sound power.
The frequency of a (sound) wave is the number of wave peaks that passes per second, and is expressed in Herz (Hz). We hear the sound frequency as a difference in pitch. This can be better understood if we think of music scales: between a low ‘do’ and a high ‘do’ the frequency is increased by a factor 2. Usually, high frequencies are expressed in kilohertz (kHz), which corresponds to 1,000 Hz.
This is the pressure which the sound waves exert on the ear drum, the receiver of sound. The further one moves away from a sound source, the weaker the sound pressure is in the ear. That is why, when measuring the sound of a machine or device, the distance is mentioned at which the measurement was done, e.g. 65 dB(A) @7 meter.
This is the total sound energy which is produced per unit of time by a machine or device, the source of the sound.
In order to determine a machine’s guaranteed sound power, the producer measures the sound power of several machines, takes the average thereof and adds a margin to it. This margin takes into account possible variations in the production (production uncertainty) and the measurement (measurement uncertainty). Therefore, the guaranteed sound power always lies higher than the measured sound power.
The immission is that which is picked up from the transmitted sound at one specific point in the environment (around a factory, installation). In this respect, “immission” is the reverse of “emission”: it is not what the source transmits, but that which “enters” the receiver. Usually, the sound immission is described by the sound pressure.
This is the result of the conversion of the immission into the emission: on the basis of the sound pressure at a specific point in the environment, the possible sound power of the source is calculated, taking into account the distance to this source.
In order to map out the noise nuisance during 24 hours, the Lden indicator is used: ‘den’ stands for ’day, evening and night’. It is the weighted average of the sound levels during the day (between 07:00 a.m. and 07:00 p.m.), the evening (between 07:00 p.m. and 11:00 p.m.) and the night (between 11:00 p.m. and 07:00 a.m.). The sound levels during the evening and night are taken into account with a greater weight in the calculation, because noise nuisance in the evening and at night are experienced as more disturbing.
Sometimes instead of the Lden, the Ldn indicator is used: ‘dn’ means ‘day and night’. It is the weighted average of the sound levels during the day (between 07:00 a.m. and 11:00 p.m.) and the night (between 11:00 p.m. and 07:00 a.m.), where the sound levels during the night have a higher weight (compare to Lden above).
This is the indicator used for mapping out the noise nuisance at night. It is the average sound level during the night, between 11:00 p.m. and 07:00 a.m.